CancerTelSys | PAINT: Construction of PAINT
Construction of PAINT
The PAINT (Predicting Alt IN Tumors) classification scheme is based on a binary decision tree.
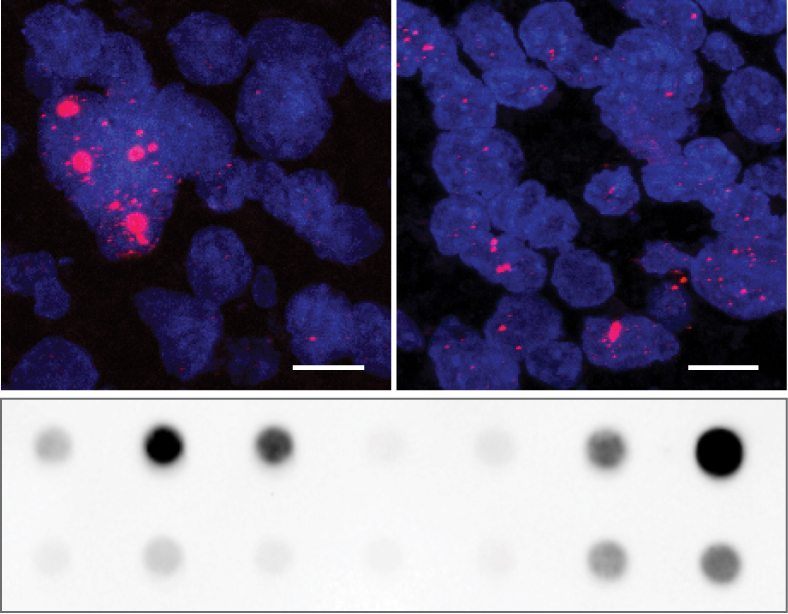
The reference sample set that was used to train this classifier was established as following: 35 pedGBM tumors (28 patient samples and 7 cell lines) from the ICCG PedBrain consortium were analyzed with respect to their activity of the ‘Alternative Lengthening of Telomeres’ pathway. To this end, they were subjected to C-circle assays and/or telomere FISH stainings in order to detect the accumulation of ALT-specific C-circles and ultra-bright telomeric foci, respectively. Samples with a positive C-circle signal were classified as ‘ALT’, while samples where both an accumulation of C-circles and ultra-bright telomeric foci were absent, or an activating TERT promoter mutation was detected, were classified as ‘non-ALT’.
Further information on these samples with respect to their telomere maintenance mechanism was acquired by imaging- or sequencing-based analyses and other approaches. This included: Detection of chromothripsis, loss of function mutations in TP53 or ATRX, K27M or G34R/V mutations in H3F3A, TERT mRNA expression levels, TERT promoter methylation, telomere content, and detection of ATRX protein.
The classes and the telomere-relevant information associated with the samples were then used to train the classifier in the following way: A sample with a positive C-circle signal is directly classified as ‘ALT’, while a sample with an activating TERT promoter mutation is directly defined as ‘non-ALT’.For all other feature combinations decision trees were calculated by minimizing the number of misclassified samples from the training set as well as the number of questions. All feature values were translated into binary values. For continuous variables (TERT expression, TERT promoter methylation and telomere content) optimal thresholds were derived from the training data set. The performance and significance of individual trees was calculated by using a leave-one-out cross-validation and is specified by the performance value P (percentage of correct predictions in the training data) and a p-value determined from the confusion matrix. Finally, the optimal tree was derived using the complete set of samples.
If a tree that comprised only a feature subset gave rise to a better performance compared with the tree constructed with all selected features, the tree from the subset was taken. Since not every feature was analyzed in every sample of the reference sample set, the size of the training data set that was used to construct a decision tree with a given combination of features varied. Due to that performance variations occur. In cases where the number of reference samples was too small, the decision tree was constructed by including additional samples with a missing feature arbitrarily selected as positive or negative. If the performance of this optimized tree was better than the reference tree that included only samples with complete information, it was selected.
For some feature combinations the small number of samples that could be employed for training purposes led to the construction of decision trees with non-significant performances (p-value > 0.05). In cases when a PAINT user selects such a combination of features as input, an additional prediction result is displayed. The latter arises from the subset of the selected features that generated the tree with an adjusted p-value ≤ 0.05 and the best performance.