CancerTelSys | PAINT: Instructions
Instructions
In PAINT (‘PAINT classifier’) a variety of features derived from different types of analyses can be selected to predict the ALT status of a tumor sample. Below is a short description of the features. Details are provided in a study by Deeg et al. that has been submitted.
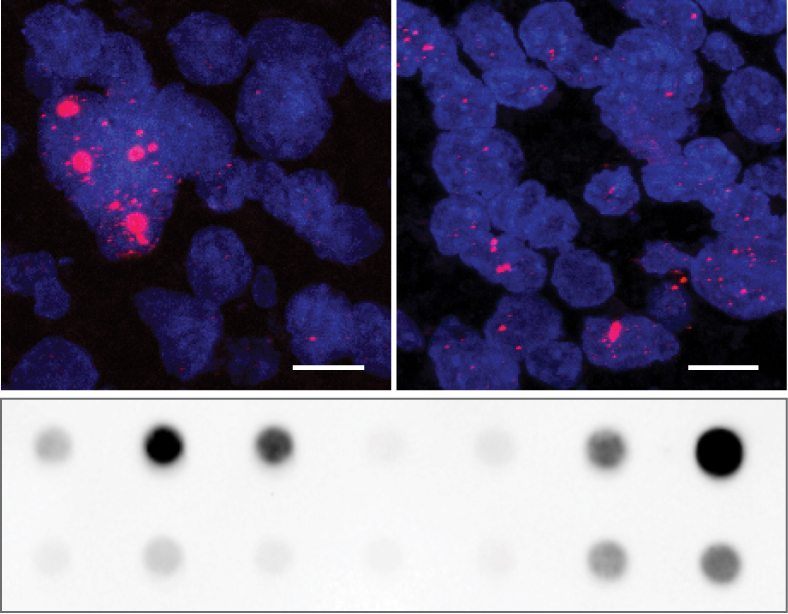
C-circle signal:
A sample is evaluated as C-circle-positive if the signal
intensity of the reaction with polymerase (+pol) is at least
1.4-fold higher than the intensity of the C-circle signal of
the reaction without polymerase (-pol) and additionally, at
least fourfold higher than the background.
TERT promoter mutation (C250T or C228T):
This refers to the nucleotide exchanges C228T (also C124T) and
C250T (also C146T) in the TERT promoter that have been
found to activate TERT expression in a variety of
cancers (reviewed in Heidenreich et al, Curr Opin
Genet Dev, 2014).
Chromothripsis:
Chromothripsis is scored according to Korbel & Campbell,
Cell (2013).
TP53 mutations, ATRX mutations:
Loss of function mutations, indels, and deletions in the genes TP53 and ATRX detected by sequencing.
H3.3 mutation (K27M or G34R/V):
Mutations in the H3.3 encoding gene H3F3A that result
in amino acid exchanges K27M or G34R/V detected by sequencing.
TERT expression:
Expression levels of the TERT transcript as determined
from RNA-Seq analysis in reads per kilobase per million mapped
reads (RPKM).
TERT promoter methylation:
This describes the methylation level at a CpG (cg11625005 on
the Illumina 450k methylation array), which maps upstream of the
TERT transcription start site. Hypermethylation of
this site has been associated with TERT expression
(Castelo-Branco et al, Lancet Oncol, 2013).
Telomere content:
Telomere content is measured by a telomere-specific qPCR as
described by O’Callaghan et al, Biotechniques (2008).
The ratio of telomere repeat signal (T) to a single copy gene
(S) is measured for both tumor and control sample. In order to
visualize the change in telomere content in tumor versus
control sample, the T/S ratio of the tumor sample is divided by
the T/S ratio of the control sample and the log2 ratio is
determined.
ATRX protein expression:
Presence of absence of ATRX is addressed by
immunohistochemistry with an anti-ATRX antibody (Sigma,
HPA001906) on FFPE tissue sections.
Ultra-bright foci:
Ultra-bright foci are detected by fluorescence in situ
hybridization (FISH) using telomere-specific fluorescently
labeled probes (CCCTAA)3. The presence
of telomeric signals with high intensity in tumor tissue
sections has been strongly associated with ALT activity
(Heaphy et al, Science 2011).
References:
- Deeg KI, Chung I, Poos AM, Braun DM, Korshunov A, Oswald M, Kepper N, Bender S, Castel D, Lichter P, Grill J, Pfister SM, König R, Jones TW & Rippe K (2017), Dissecting telomere maintenance mechanisms in pediatric glioblastoma, manuscript submitted.
- Heidenreich, B., Rachakonda, P. S., Hemminki, K., & Kumar, R. (2014). TERT promoter mutations in cancer development. Current Opinion in Genetics & Development
- Korbel, J.O. & Campbell, P.J. (2013). Criteria for inference of chromothripsis in cancer genomes. Cell
- Castelo-Branco, P., Choufani, S., Mack, S., Gallagher, D., Zhang, C., Lipman, T., et al. (2013). Methylation of the TERT promoter and risk stratification of childhood brain tumours: an integrative genomic and molecular study. The Lancet. Oncology
- O'Callaghan, N., Dhillon, V., Thomas, P., & Fenech, M. (2008). A quantitative real-time PCR method for absolute telomere length. Biotechniques
- Heaphy, C. M., de Wilde, R. F., Jiao, Y., Klein, A. P., Edil, B. H., Shi, C., et al. (2011). Altered telomeres in tumors with ATRX and DAXX mutations. Science